We also asked our respondents to rank and prioritise a set of nine types of policies they wanted government to focus on: reducing housing costs; improving neighbourhood parks and recreation facilities; enhancing local social programs (job training, youth programming, and newcomer programs); increasing health care access; maintaining roads; supporting local artists; supporting local businesses; and improving local schools. For these same areas, we asked respondents whether they would support a tax increase for their priorities, as a way to capture the degree of public appetite and sense of urgency with which each area should be addressed. The below figure shows the proportion of respondents that placed each of these policy areas among their top 3 priorities.
This figure shows the percentage of respondents who selected each policy area as one of their three most important priorities. Whiskers show 95% confidence intervals.
Generally, resident priorities fell into three broad groups. On the one end is reducing housing costs, which 60% of respondents considered to be a policy issue of central importance. Our lower SES neighbourhoods gave this issue even greater priority, though in higher income neighbourhoods a majority still considered this a top priority. This speaks to the broad sense of crisis in Toronto around housing affordability. In the middle are a range of policy areas that 30-40% of respondents supported, running from maintaining roads to improving health care access. Within this set of issues, focus neighbourhoods gave higher priority to schools, whereas control neighbourhoods were more likely to prioritise transit. Overall, the number of policy areas in this range speaks to the diversity of concerns among inner suburban residents, and to some of the challenges in building political coalitions. At the border of this range is support for local business (around 25%, stronger in the control neighbourhoods), and then at the other extreme is support for local artists, which less than 10% of respondents placed among their top 3 priorities.
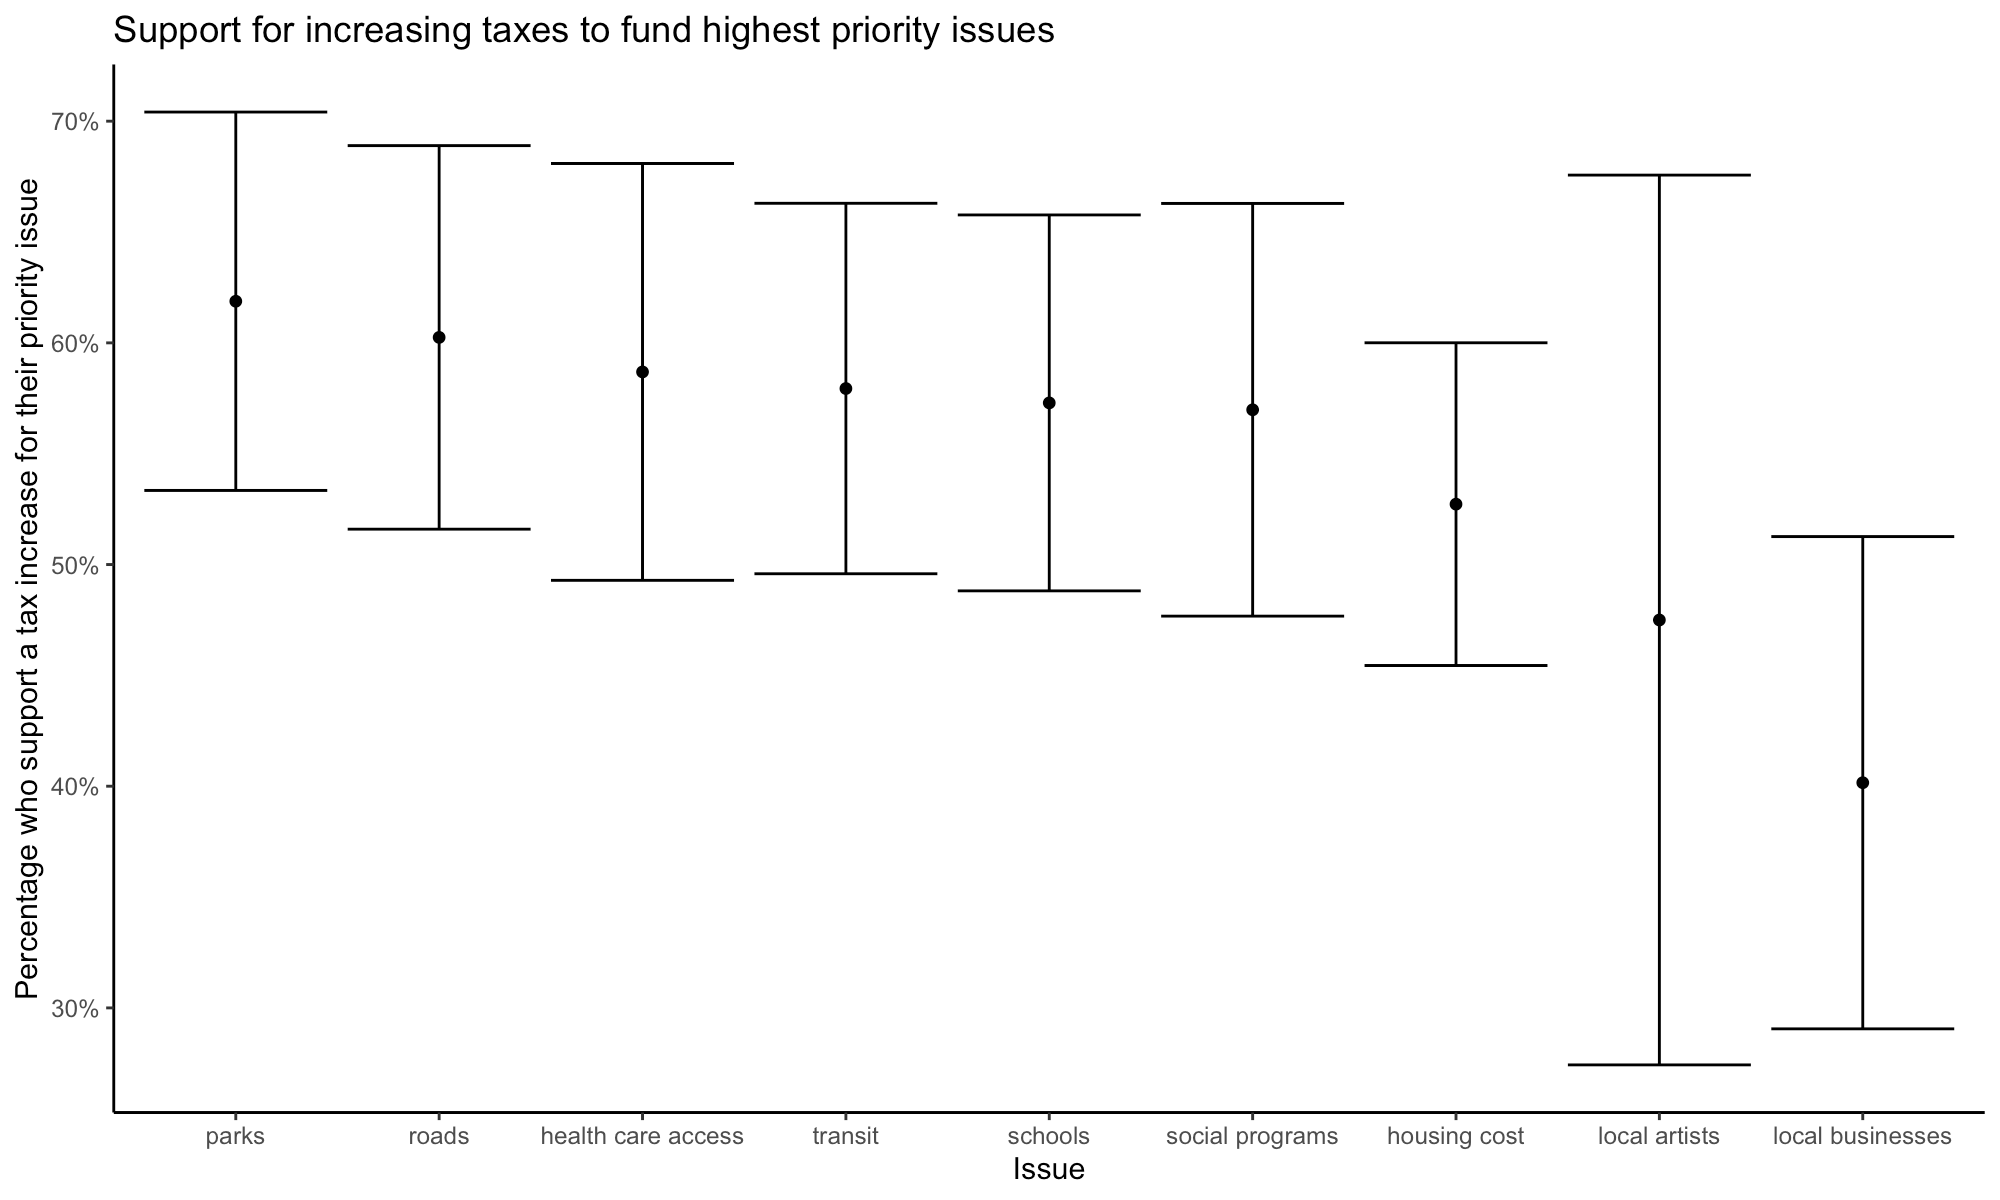
Perhaps just as important is that fact that, as the figure to the right shows, a majority of respondents are willing to pay increased taxes for their high priority concerns, including to reduce housing costs. This willingness to support increased taxes in areas they deem important was shared between focus and control neighbourhoods.
This figure shows the percentage of respodents who were willing to support a tax increase to fund their preferred policy priorities. Whiskers show 95% confidence intervals.