What Residents Value in their Neighbourhoods

What Residents Value in their Neighbourhoods
Key Points
- Residents’ definitions of their neighbourhoods rarely align with official City definitions, and this is even less common in lower SES communities.
- We conducted a “conjoint survey experiment” that identifies causes of neighbourhood desirability.
- The strongest causes include: safety, commute time, school quality, mutual support from neighbours, parks & green space, a built environment not dominated by high rises. These desires transcend socio-economic status.
- Many residents perceive their actual neighbourhoods to fall short of the experimentally identified ideal. The gap between desirable and actual neighbourhood is a very strong predictor of key indicators of wellbeing, including overall neighbourhood satisfaction, self-reported health, and confidence in civic institutions.
- Housing Cost is the highest policy priority, especially in lower SES neighbourhoods.
- Residents show strong willingness to support tax increases for their top policy priorities.
- Residents are most satisfied with local parks and green spaces, and least satisfied with local youth services.
- Interviewees were asked “what do you like most about your neighbourhood?” The most common responses were about local amenities, convenient access, transit, and diversity.
The meaning of “neighbourhood”
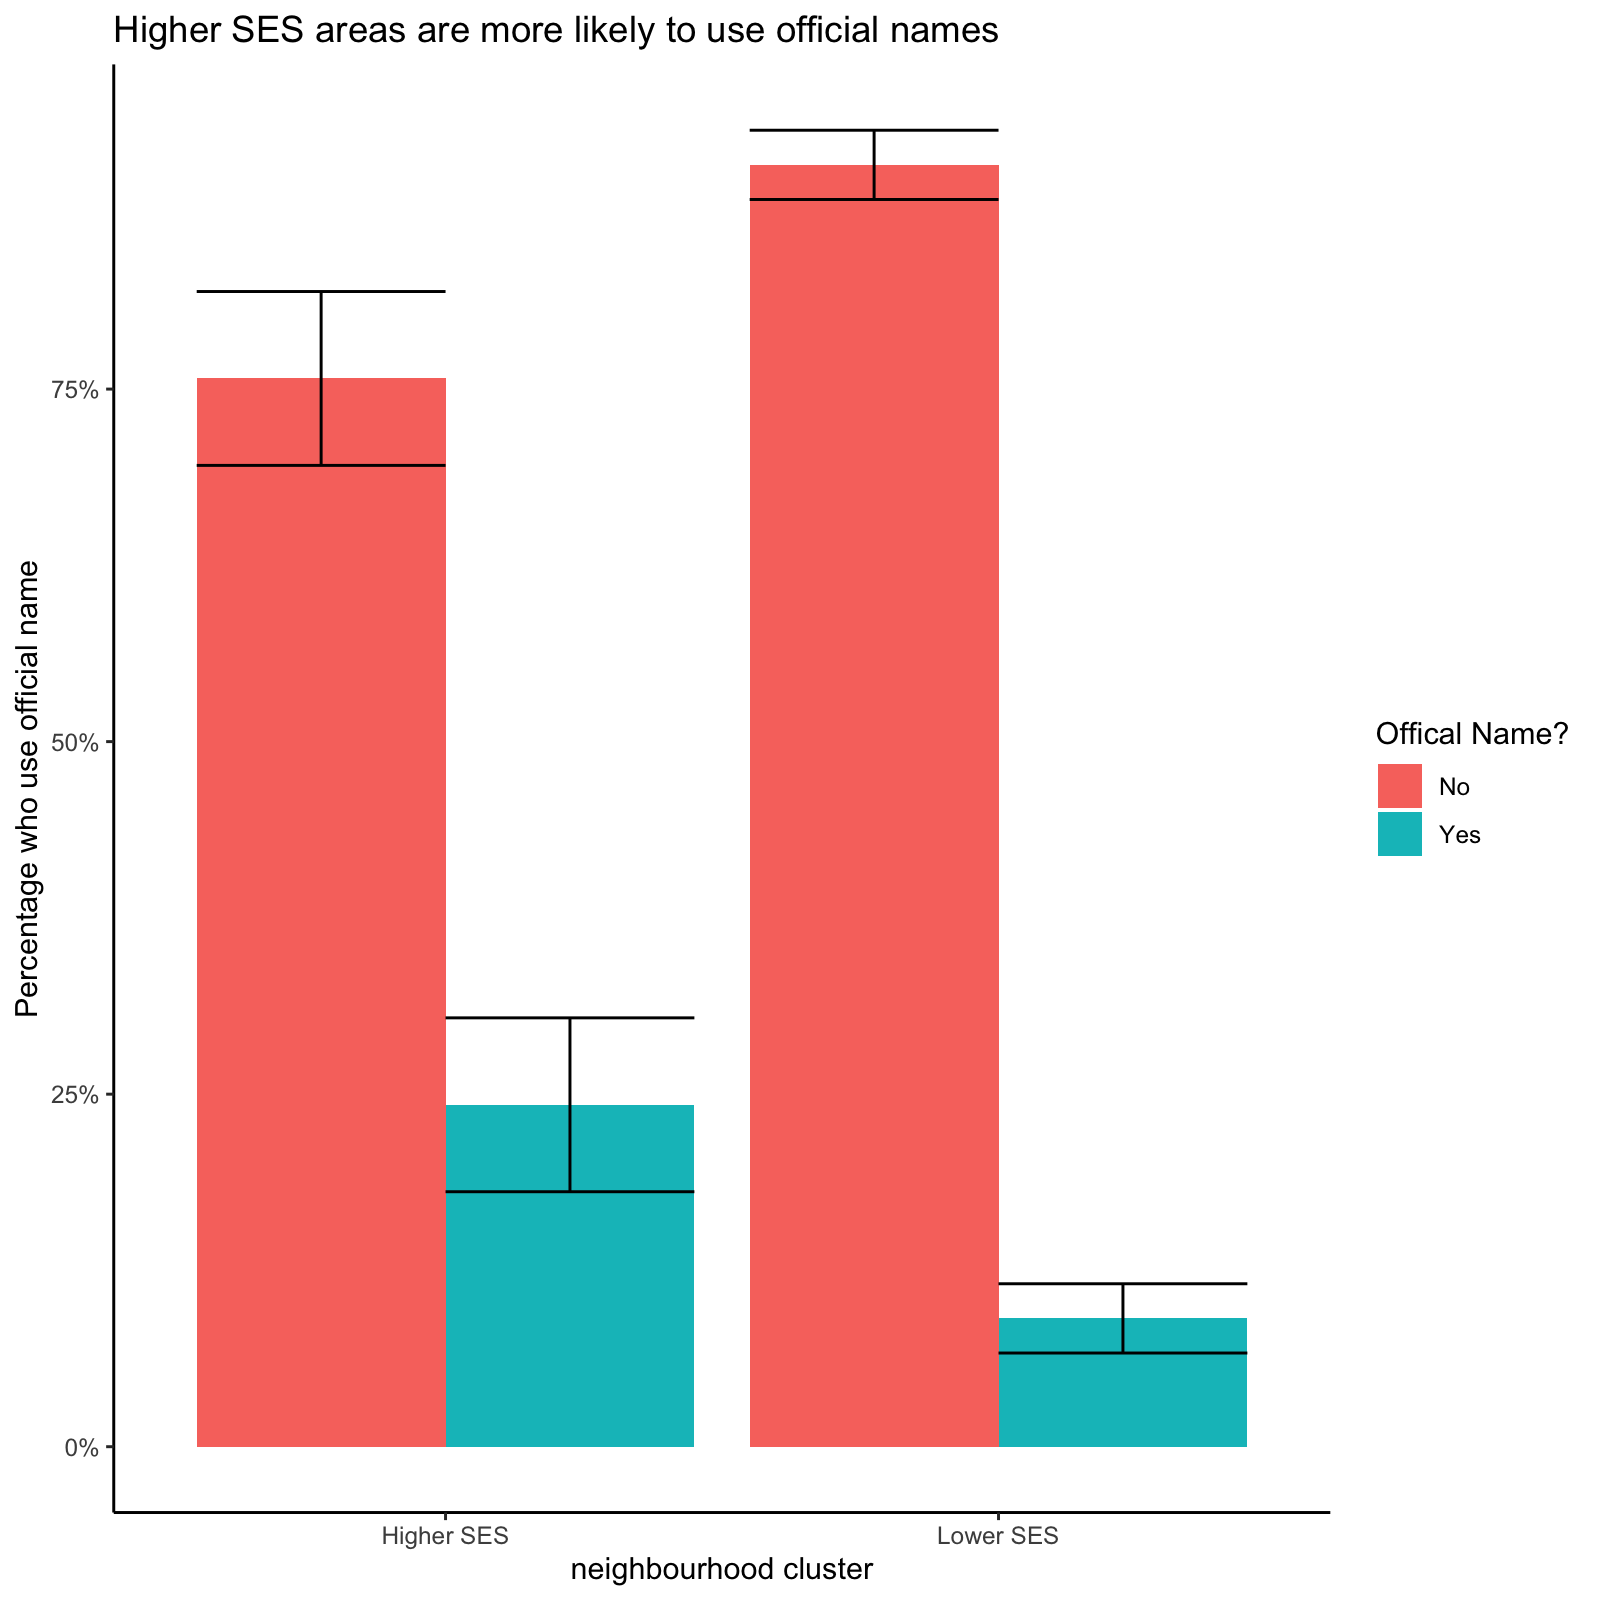
To understand what residents prioritise in their neighbourhoods, it is important to get a sense of what they understand their neighbourhood to be. Our study, and much of city policy making in Toronto, uses the City of Toronto official neighbourhoods as the major unit of analysis. We found, however, that respondents rarely described their neighbourhoods with the official City of Toronto names: only about 13% did so. More commonly (about 25%) residents would refer to former municipalities from pre-amalgamation Toronto, such as Scarborough or Etobicoke, or to nearby streets or intersections (about 20%). Still, there were significant differences between the lower SES neighbourhoods and the two upper SES areas we surveyed. In those latter cases, nearly 25% of respondents used the official neighbourhood name, whereas in the lower SES areas less than 10% did. This is one small example of how upper status areas possess advantages in asserting their policy views, by having a more shared conception of what their neighbourhood is that also aligns with the official City view.
Click on the figure to enlarge. In this figure, we show results separately for our focus neighbourhoods as well as the control areas, to highlight interesting and significant differences. Other graphs show only overall results as they are largely similar, though we comment on differences that are statistically significant. Elsewhere we dig deeper into the basis of these differences between and within neighbourhoods.


